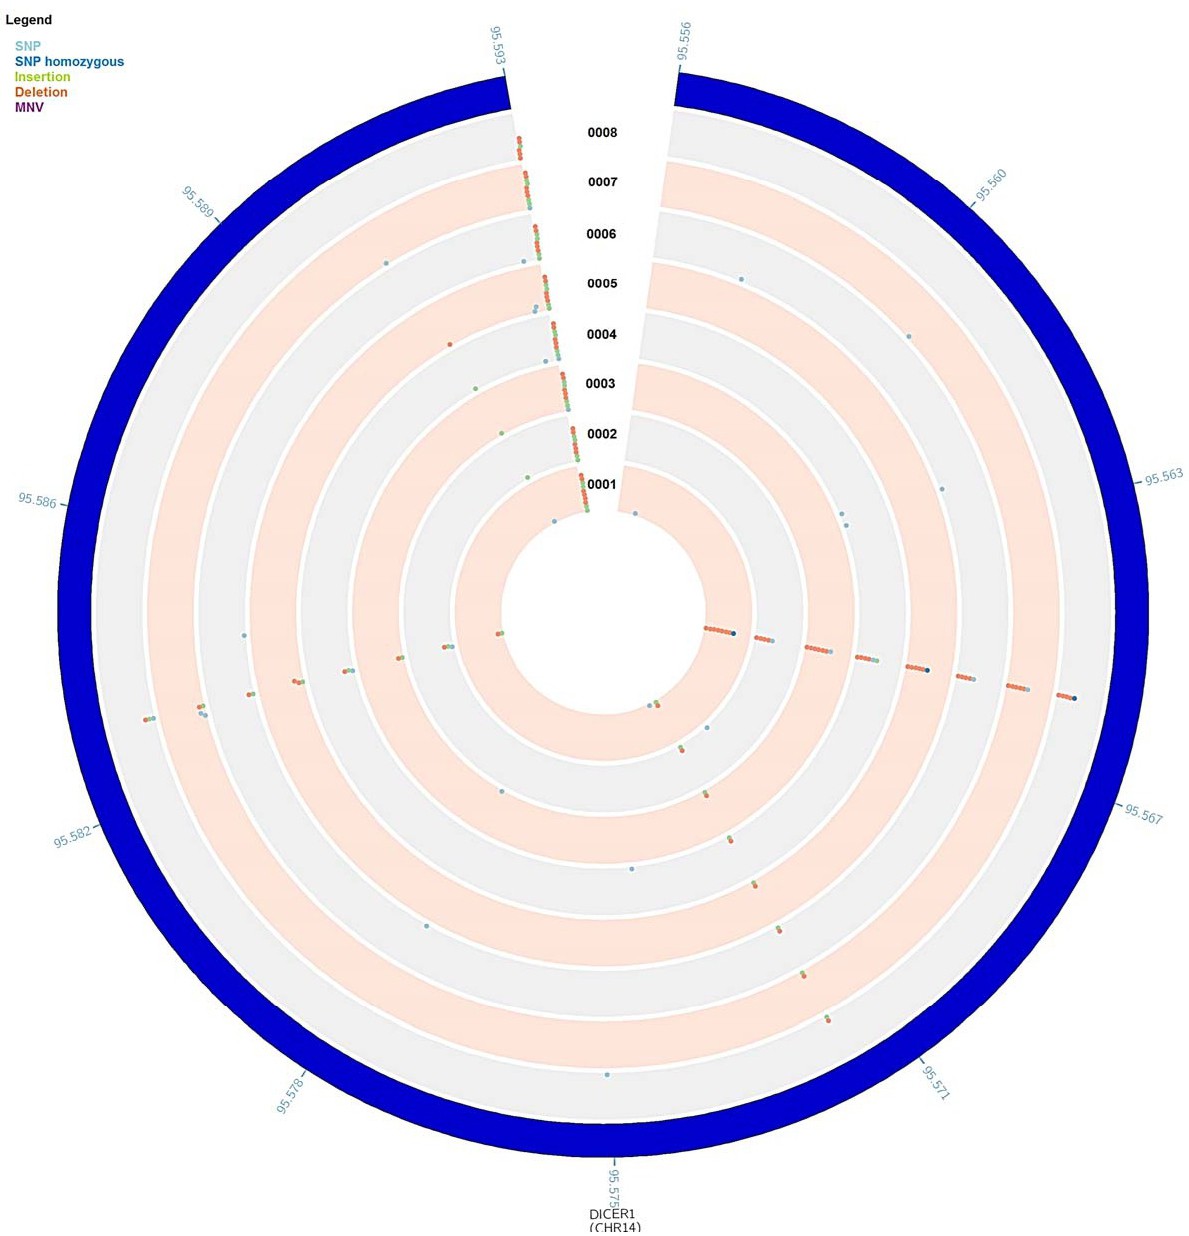
Fig. 1. Color-coded Circos plot with one track per sample was generated showing variants of the DICER1 gene in nodular basal cell carcinoma samples (samples 1 to 8). Tracks are labeled with the sample number. Within one track, dots are stacked if they are at the same or adjacent coordinates. Variants in the input files are symbolized in the plot with a colored dot in the DICER gene at the affected coordinate. The color of the dot is coding for the type of the variant. Variations include single nucleotide polymorphisms (SNPs; light blue), homozygous SNPs (turquoise), insertions (green), deletions (orange), and multiple nucleotide variation (MNV; purple).